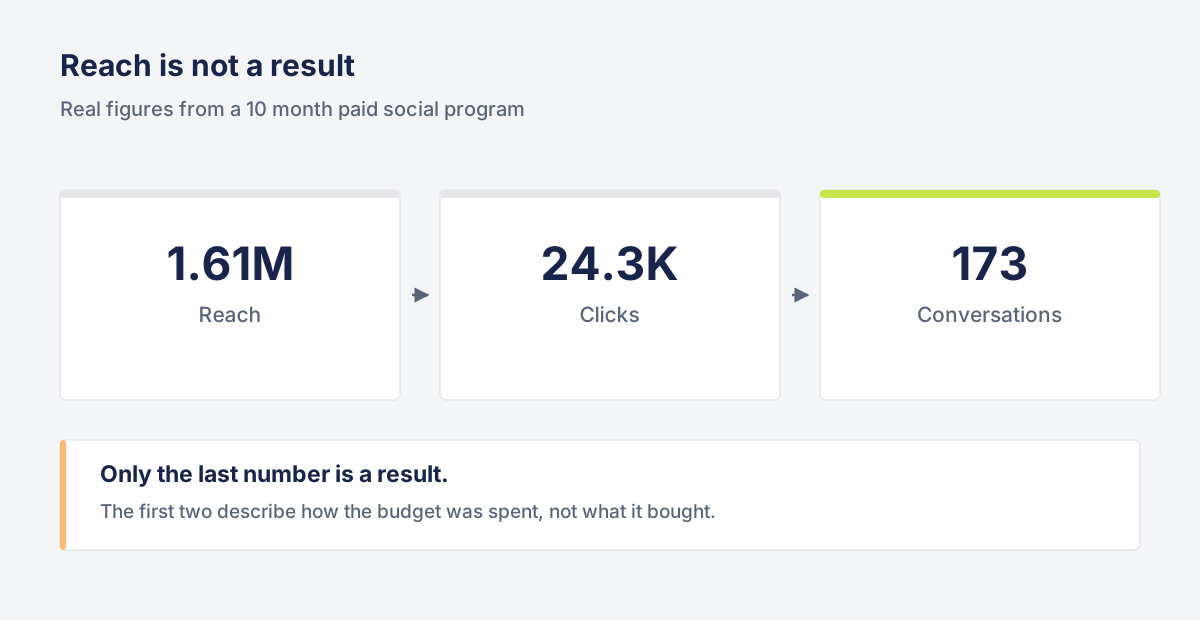
Open almost any paid social report and the first thing you see is reach. It is the largest number available, it always goes up when you spend more, and it tells you close to nothing about whether the campaign worked.
The test is simple
Ask what the number would have to be for you to change something. Reach going from 1.4 million to 1.6 million changes nothing about how you run the account. Cost per conversation moving from 30 dollars to 60 dollars changes everything. One is a description of spending, the other is a decision.
Clicks sit awkwardly in the middle. They are closer to intent than reach, but a click is still someone deciding to look, not someone deciding to act. Useful as a diagnostic, weak as a headline.
Split the objectives or the average lies to you
Running several objectives inside one campaign produces a blended cost per result that belongs to none of them. On a ten month program I kept messaging, landing page views, profile visits and app installs on separate ads for that reason. Cost per result ranged from 22 cents at one end to over 44 dollars at the other. A single average would have hidden both. The breakdown is in the paid social case study.
What to put at the top of the report
Lead with cost per result for the objective the campaign was built for, then show spend, then show the volume metrics underneath as context. If reach is the most interesting thing you can say about a campaign, the campaign has not done anything yet.
Getting this right depends on the tracking underneath being correct, which is its own piece of work. That is covered on the analytics and tracking page. The campaign management side is on paid social.